The Much Awaited 2026 Delimitation Exercise of Lok Sabha Constituencies
- In Current Affairs
- 10:32 AM, Nov 13, 2020
- Surendranath C
Taxation and Representation
There is a common discussion about taxes raised from different States of India and the devolution of tax revenue to states. A common complaint is that certain States benefit by having a higher receipt from the Centre as opposed to taxes raised from within the State.
Industrialized States often receive less than what is raised from the states. There are some merits to this perception of an anomaly, but there is a balancing argument
- Corporates are not distributed evenly, but are often headquartered disproportionately more in the industrialized states, thus increasing their share of corporate taxes.
- White collar workers are resident in higher numbers in industrialized states, thereby increasing their share of personal income tax.
- However, when we review the distribution of consumption, we find that GST collections are more uniform across the country.
From these facts, we can conclude that the corporate income taxes and personal income taxes contributed by industrialized states are a consequence of the revenue and income they earn from the consuming populations all across the country.
From this, let us approach the question of equitable development across the country from a different perspective. Are all states and regions equally represented in our national democracy?
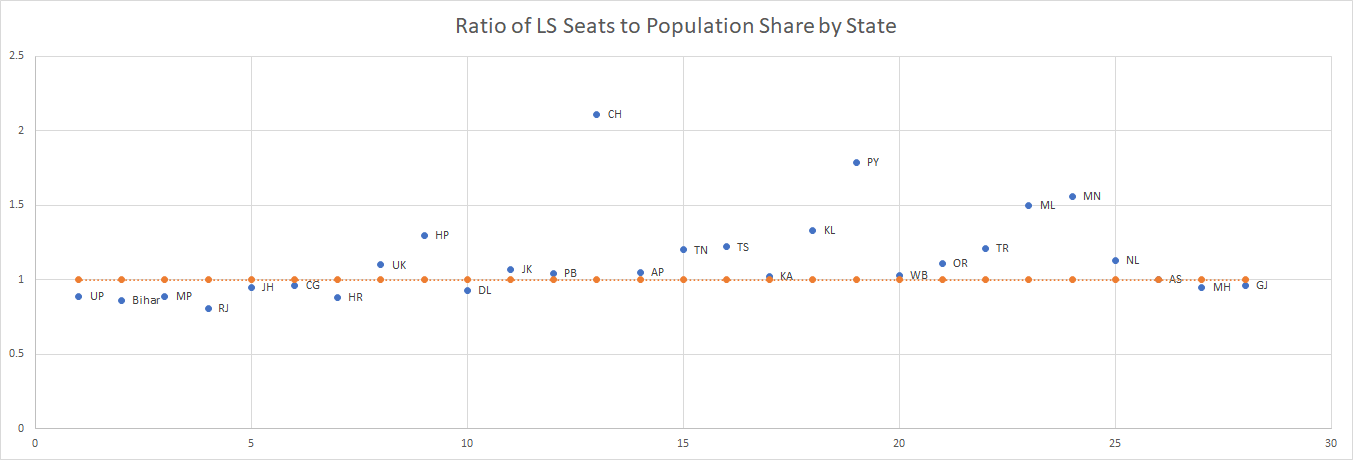
The primary indicator of representation is the Lok Sabha. Here we present data from the 2011 census and the Election Commission to compare number of Lok Sabha seats against the population of different States
Representation
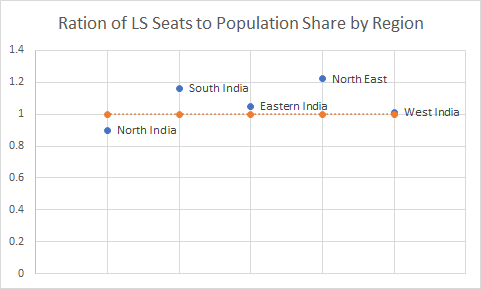
We compare the availability of Lok Sabha Seats vs the Population of States and Regions


Observations
- East and West India regions have representation largely in proportion to their population.
- North India is less represented in the Lok Sabha
- South India has higher representation as does the North East. There is a specific reason for this, the populations of North Eastern States are very small and just 1 or 2 seats across large swathes of territory.
- This is quite understandable, considering that the delimitation of Lok Sabha Constituencies has been performed on the basis of the 1971 census.
- In the half-century since, the Southern States have implemented family planning better and as a result, many of the Southern States are at a TFR less than replacement rate of 2.1.
2026 Delimitation
The delimitation is expected to be revisited every few decades. However, in 1976, during the Emergency, when the policy makers had population control as among their top priorities, the delimitation was postponed to 2001, until population percentages and growth rates had drawn even across the country.
In 2002, another amendment was made to postpone it to 2026. Now, 5 decades since, the question is again upon us.
The primary dilemma here is:
Do we increase representation for the states in proportion to their population, thereby rewarding failure to implement population control and, by inference, several key interventions in improving socio-economic indicators? Or do we continue to deny adequate representation to a large and increasingly aspirational population?
It is our contention that representation is the fundamental building block of democracy, ahead of other ideals such as equity and liberty. This is why the bankrupt and billionaire, the illiterate and the Ph D all have the same single vote. We can extend this same principle and claim equity only if the migrant labourer family with 4 children has the same level of representation as the urban DINK couple.
In fact, improving representation may even improve the delivery of services and thereby help in converging population growth rates faster.
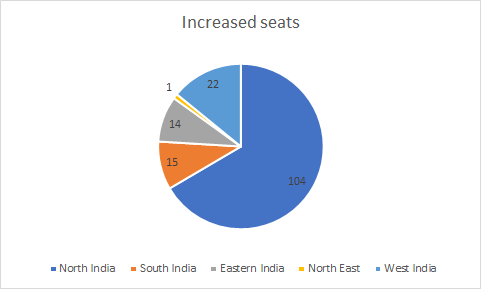
Now, we come to the question of what form this exercise will take. Let us perform a simple thought experiment and assume that the number of seats is increased from the current 543 to 700, and the new seats are allocated to States based on their share of the population. Assuming that we use the population numbers from the 2011 census, here is a list of the big winners. As we can see, the big winners would be the Hindi heartland states, Maharashtra, Gujarat and West Bengal. We can expect a lot of resistance from the Congress, southern regional parties to this, since this will cut into their bastions.
However, if such an exercise is carried out, we can safely assume that this will strengthen the Hindu vote bank where Hindu electoral consolidation has advanced well
|
State |
Increase |
|
Uttar Pradesh |
36 |
|
Bihar |
20 |
|
Maharashtra |
17 |
|
Rajasthan |
15 |
|
Madhya Pradesh |
13 |
|
West Bengal |
11 |
|
Gujarat |
9 |
|
Karnataka |
7 |
|
Andhra Pradesh |
6 |
|
Jharkhand |
5 |
|
Haryana |
5 |
|
Chhattisgarh |
4 |
|
Delhi |
3 |
|
Punjab |
3 |
|
Tamil Nadu |
3 |
|
Orissa |
3 |
|
Uttarakhand |
1 |
|
Jammu and Kashmir + Ladakh |
1 |
|
Telangana |
1 |

|
State |
Population Percentage |
Lok Sabha Seats |
Percentage |
|
North India |
49.9% |
245 |
45.1% |
|
Uttar Pradesh |
16.5% |
80 |
14.7% |
|
Bihar |
8.6% |
40 |
7.4% |
|
Madhya Pradesh |
6.0% |
29 |
5.3% |
|
Rajasthan |
5.7% |
25 |
4.6% |
|
Jharkhand |
2.7% |
14 |
2.6% |
|
Chhattisgarh |
2.1% |
11 |
2.0% |
|
Haryana |
2.1% |
10 |
1.8% |
|
Uttarakhand |
0.8% |
5 |
0.9% |
|
Himachal Pradesh |
0.6% |
4 |
0.7% |
|
Delhi |
1.4% |
7 |
1.3% |
|
Jammu and Kashmir + Ladakh |
1.0% |
6 |
1.1% |
|
Punjab |
2.3% |
13 |
2.4% |
|
Chandigarh |
0.1% |
1 |
0.2% |
|
South India |
20.8% |
131 |
24.1% |
|
Andhra Pradesh |
4.4% |
25 |
4.6% |
|
Tamil Nadu |
6.0% |
39 |
7.2% |
|
Telangana |
2.6% |
17 |
3.1% |
|
Karnataka |
5.0% |
28 |
5.2% |
|
Kerala |
2.8% |
20 |
3.7% |
|
Puducherry |
0.1% |
1 |
0.2% |
|
Lakshadweep |
0.0% |
1 |
0.2% |
|
Eastern India |
11.0% |
63 |
11.6% |
|
West Bengal |
7.5% |
42 |
7.7% |
|
Orissa |
3.5% |
21 |
3.9% |
|
North East |
3.8% |
25 |
4.6% |
|
Tripura |
0.3% |
2 |
0.4% |
|
Meghalaya |
0.2% |
2 |
0.4% |
|
Manipur |
0.2% |
2 |
0.4% |
|
Nagaland |
0.2% |
1 |
0.2% |
|
Arunachal Pradesh |
0.1% |
2 |
0.4% |
|
Mizoram |
0.1% |
1 |
0.2% |
|
Sikkim |
0.1% |
1 |
0.2% |
|
Assam |
2.6% |
14 |
2.6% |
|
West India |
14.5% |
79 |
14.5% |
|
Maharashtra |
9.3% |
48 |
8.8% |
|
Gujarat |
5.0% |
26 |
4.8% |
|
Dadra and Nagar Haveli & Daman and Diu |
0.0% |
2 |
0.4% |
|
Goa |
0.1% |
2 |
0.4% |
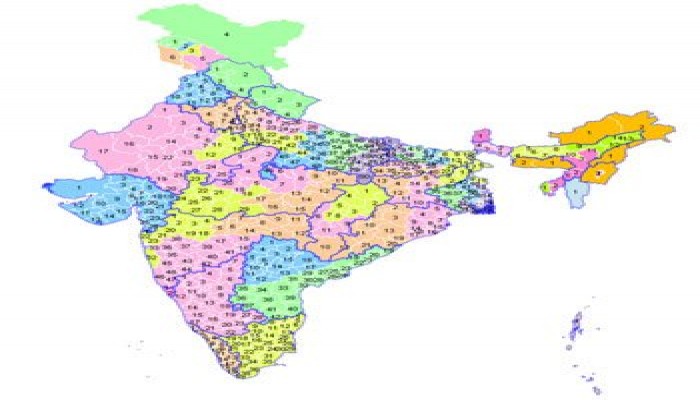
Image Credit: Election Commission of India


Comments