




Size of the Agricultural Economies and Global Importance of Different Agricultural Commodities: An Overview
- In Economics
- 11:48 AM, Aug 17, 2026
- Mukul Asher
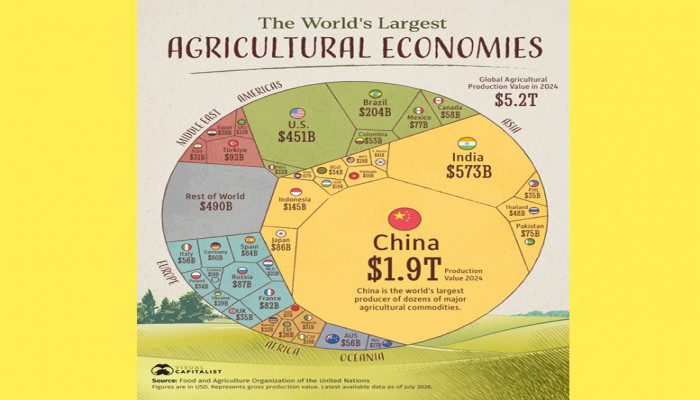
As ensuring food security becomes a prominent public policy objective globally, the value of agricultural production in various countries, which indicates scale, and the global relative importance of various agricultural products are among the useful inputs for conducting informed public policy debates on food security in any country.
In the current global environment where economic factors, non-economic factors, and resources are increasingly weaponised, having scale in agricultural economies, with the ability to contribute to the food security of others, gives a country additional relevance and therefore leverage in international relations.
Figure 1 provides data on the value of agricultural production in 2024 of USD 5200 billion by regions and by selected countries. In 2024, global agricultural exports were USD 1500 billion, about 28 per cent of the global value of agricultural production.1

Figure 1: Agricultural Economies by Value: A Global Overview
The following observations may be made from the data in Figure 1.
China is by far the largest contributor to the value of agricultural economies, accounting for USD 1900 billion, equivalent to 36 per cent of the global total of USD 5200 billion in 2024. India is a distant second, with the value of USD 573 billion, equivalent to 11 per cent of the global total. The United States' share is about 8 per cent, with a value of USD 451 billion. The three countries together account for 55 per cent of the total global value of agricultural production.
Prime Minister Modi has outlined "Saptadhara"—seven key growth engines or streams of national strength designed to help progress India toward a self-reliant (Aatmanirbhar) Viksit or Advanced Bharat status by 2047. In the seven, expanding agriculture and food processing, turning traditional goods like millets, spices, and local produce into global export brands, finds a prominent place. Thus, India must focus its national energies on enhancing the value of its agricultural production at an accelerated pace.
If the fourth largest country, Brazil, valued at USD 204.0 billion (3 per cent of the global total), and the fifth largest, Indonesia, valued at USD 145 billion (2 per cent of the global total) were added, then three-fifths of the global agricultural production by value is accounted for by just these five countries. In no other country in the world does the value of agricultural production exceed USD 100 billion.
In Europe, the single largest value of agricultural production is exhibited by Russia at USD 87 billion, followed by France (USD 82 billion) and Spain (USD 64 billion). Germany (USD 60 billion) and Italy (USD 56 billion) are other countries with substantial agricultural production value. Europe has found good acceptance in global markets in higher-value agriculture alongside its leading position in processed food and beverage exports.
In Africa, the largest value of agricultural production is in Algeria (USD 31 billion). In the Middle East, Turkiye, at USD 92 billion, has the highest value of agricultural production.
Among the above five countries, in 2024, the United States had a deficit in agricultural trade internationally of USD 28.9 billion (Exports USD 176 billion and imports USD 204.9 billion).2
According to the FAO (Food and Agriculture Organisation) data, the other four countries exhibit a surplus in agricultural trade. Brazil exhibits the largest surplus in agricultural trade globally of USD 149.0 billion (Exports USD 169.2 billion, imports USD 20.2 billion), underscoring its pivotal global role in the agricultural sector and, therefore, global relevance and leverage. China (USD 12.0 billion) (exports USD 49.7 billion, imports 37.7 billion); India (USD 13.6 billion) (exports USD 52 billion, imports USD 38.5 billion) and Indonesia (USD 20.9 billion) (exports USD 46.9 billion, imports USD 26.0 billion) exhibit moderate surpluses in the agricultural sector.
The pattern that a high value of agricultural production is not needed to have a significant role in international trade in the agricultural sector is also evident from the data from the FAO for countries other than the five indicated above. Thus, Argentina had agricultural exports of USD 48.8 billion and imports of only USD 5.5 billion in 2024, giving a surplus of USD 42.5 billion. In 2024, Australia had a trade surplus of USD 56.9 billion (exports of USD 75.8 billion and imports of USD 18.9 billion). Canada had an agricultural trade surplus of USD 27.4 billion (exports of USD 74.0 billion and imports of USD 46.6 billion).
France, with exports of USD 83.4 billion and imports of USD 74.6 billion and Italy, with exports of 75.6 billion and imports of USD 82 billion, have a notable global presence in the agricultural sector.
There are some countries with large deficits in the agricultural sector. These include Japan with a deficit of USD 52.6 billion (exports USD 9.9 billion, imports USD 62.5 billion); the United Kingdom with a deficit of USD 50.6 billion (exports of USD 31.5 billion and imports of USD 82.1 billion); and South Korea with a deficit of 27.5 billion (Exports USD 13.3 billion, and imports of USD 40.5 billion).

Figure 2: Value in USD of the World’s 40 Food Commodities
The following observations may be made from Figure 2
-
The largest single sub-category in food products is the Produce (USD 1233 billion), accounting for 28 per cent of the total value of USD 4300 billion.
Tomatoes (USD 136 billion), Potatoes (122 billion), and apples (USD 112 billion) are the only three valued at over USD 100 billion. The value of grapes (USD 97 billion) and of sweet potatoes (USD 89 billion) is approaching USD 100 billion. There are, however, several items, not usually given much prominence, such as mushrooms (USD 61 billion), cassava (USD 51 billion), and chillies (USD 51 billion), which exhibit moderately high value. Those countries pursuing agricultural upgradation and diversification could consider a micro-level approach to which produce hold promise given their local conditions.
-
The second largest category is meat, accounting for 23 per cent, or USD 1024 billion. In this category, Pork at USD 355 billion is the largest item, followed by beef at USD 306 billion, and chicken at USD 264 billion. Lamb (USD 61 billion) and goat meat (USD 38 billion) are of relatively less significance in terms of value of production.
-
The third largest category is grains, accounting for 20 per cent, or USD 867 billion. In grains, rice (USD 362 billion) is the largest single food item by a significant margin. It is followed by corn (USD 270 billion) and wheat (USD 209 billion). Soya beans is the other crop whose value, at USD 142 billion, exceeds USD 100 billion. Other notable crops by value are palm oil (USD 67 billion), peanuts (USD 64 billion), and beans (US 34 billion). These should not be overlooked in diversification and value addition policies for grains.
-
The fourth largest category is dairy and eggs, accounting for 14 per cent of the total, valued at USD 613 billion. In this category, milk at USD 379 billion is by far the single largest item. IN no other food category is the value of a single item so high as for milk. Indeed, if buffalo milk (treated in Figure 2 as a separate item) with a value of USD 76 billion were added to milk, the dominance of the combined milk item in food production value would be even larger. Eggs (USD 157 billion) are also of major importance globally.
-
The fifth largest category is oilseeds and legumes valued at 354 billion, or 8 per cent of the total. Legumes are a large family of plants (Fabaceae) that produce seeds inside pods. This broad category includes everyday foods like beans, lentils, peas, chickpeas, and peanuts. Nutritionally, they are rich in plant-based protein, complex carbohydrates, and dietary fibre.
The value of soya bean (USD 142 billion) is by far the largest item in this category. Palm oil (USD 67 billion) and peanuts (USD 64 billion) are the next largest items. They are followed by canola seeds (USD 48 billion) and beans (USD 34 billion).
-
The sixth, and the last category, is crops, valued at USD 246 billion, equivalent to five per cent of the total. In crops, sugar cane (USD 96 billion) is the largest category, followed by tea leaves (USD 78 billion), and seed cotton (USD 72 billion).
To conclude, pursuing food security has become an imperative for countries around the globe in the current fragile and protectionist global environment, where the food sector is being weaponised to impact a wide variety of sectors. The science-based, outcome-oriented approach to agriculture, strongly supported by the political will of the elites, can also make the agricultural sector one of the growth nodes for many countries.
References
-
https://www.wto.org/english/tratop_e/agric_e/ag_imp_exp_charts_e.htm#mapHeading (Accessed on 2 August 2024)
-
https://www.statista.com/chart/35606/main-food-products-exported-and-imported-by-the-united-states/?srsltid=AfmBOoqiA5gPHFqqAGyjiiW2Gr2mOS2RIwEOiKqor1bOSiQNW7TbTdRd (Accessed on 5 August 2026)



 Loading...please wait
Comments