Recent Fiscal Discipline Strategy by Indian Policymakers: An Overview of State Finances
- In Economics
- 08:32 PM, Nov 11, 2024
- Dhiresh Kulshrestha
The Central Government of India, for FY 2024-25, has aimed at ‘Less Expenditure, More Income’ for the Indian states so that their financial positions can be controlled. But the National Stock Exchange (NSE) has issued a report- ‘State of States’ revealing that on the one hand, Punjab and Rajasthan have a high financial burden, on the other hand, Gujarat and Madhya Pradesh, with a rising fiscal burden, might create a hurdle for the Central Government. It has also been said that MP’s fiscal deficit is 4.1% of its GDP. Other than Himachal (4.7%), MP (4.1%) is the only state with an income-expenditure gap of more than 4%.
India’s fiscal policy revolves around financial well-being, reflecting regional and national-level dynamics. The NSE (State of States, 2024) report reveals trends in the debt positions of Indian states. States like Gujarat and Madhya Pradesh have increased debt, while other states like Rajasthan and Punjab have reduced it. In fiscal-budget 2024-25, out of 21, 8 states expect a rising trend and 13 states, a decline in expenditure. Bihar is at no. 1 position in reducing the fiscal position, followed by Chhattisgarh, Himachal, and Jharkhand, whereas, MP is least concerned about its financial status. According to Dr. Manoranjan Sharma, Chief Economist-Infomerics Ratings, free welfare schemes and old pension schemes substantially worsen the states’ fiscal position (Outlook Business Report, 2024).
As per NSE, thirteen states are expected to reduce their fiscal deficits relative to GDP in 2024-25. States’ debt measured as a proportion of GDP, is considered crucial for assessing the financial health of states. Gujarat (0.76%) and MP (0.51%) have significantly raised their borrowings. In contrast, Rajasthan and Punjab have made reductions in their debt burdens of 0.4% and 0.32% respectively. UP has taken most debt which is 47.6% relative to GDP, while Telangana is at the bottom with 13.9%, bringing its fiscal deficit down to 3% in 2024-25 from 3.4% in 2023-24. Bihar has made great progress in improving its debt position from a fiscal deficit 8.9% to 3% in 2024-25.
Given statistics show us a clear picture that among the states, in UP, the debt burden is about 47.6% of the state GDP. Similarly, in the case of Tamil Nadu, the ratio is 44.3%, in Karnataka, 44.2%, in Punjab 42.1%. In contrast, in Telangana, the ratio is 13.9%, with the lowest debt burden, followed by Himachal (18.2%), MP (22.7%) and Gujarat (24%). In Bihar, it is 26.6% and in Jharkhand, it is 29.9%. However, since the last year, the revenue generation has increased by 16.7%.
A summary of 10 states is shown in Table 1, Figure 1.
Table 1: Debt to GDP ratio: Comparison
|
States |
Debt-to-GDP (2024-25) |
Debt-to-GDP (2023-24) |
Population |
Area (in Km2) |
|
Uttar Pradesh |
47.6 |
31.7 |
199,812,341 |
240,928 |
|
Tamil Nadu |
44.3 |
25.6 |
72,147,030 |
130,060 |
| Karnataka |
44.2 |
23 |
61,095,297 |
191,791 |
|
Punjab
|
42.1 |
46.8 |
27,743,338 |
50,362 |
|
Jharkhand |
29.9 |
27 |
32,988,134 |
79,716 |
|
Bihar
|
26.6 |
35.7 |
104,099,452 |
94,163 |
|
Gujarat |
24.0 |
15.3 |
60,439,692 |
196,244 |
|
Madhya Pradesh |
22.7 |
30.4 |
72,626,809 |
308,252 |
|
Telangana |
13.9 |
23.8 |
-- |
-- |
|
Chhattisgarh |
24.4 |
25 |
25,545,198 |
135,192 |
Note: PRS Legislative Research
Figure-1: Debt-to-GDP Ratio Graphic
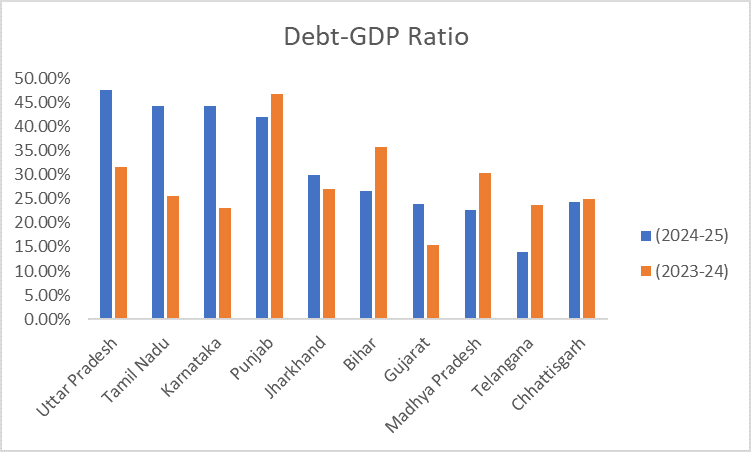
Table 1 also interprets states with large populations and extensive areas like Uttar Pradesh and Tamil Nadu face increasing debt burden. States like Karnataka, with a moderate population and large area experience rising debt. In contrast, states like Punjab, and Jharkhand, with relatively smaller populations and areas have somewhat controlled debt ratios. Similarly, Bihar, a densely populated state reduced its debt-GDP ratio highlighting potential improvements.
Table 2:
|
State |
Fiscal Deficit (%) 2024-25 |
Fiscal Deficit (%) 2023-24 |
|
Chhattisgarh |
3.8% |
7.3% |
|
Bihar |
3.0% |
8.9% |
|
Himachal Pradesh |
4.7% |
5.9% |
|
Jharkhand |
2.0% |
2.7% |
|
Andhra Pradesh |
3.5% |
4.2% |
|
Telangana |
3.0% |
3.4% |
|
Rajasthan |
3.9% |
4.3% |
|
Punjab |
3.8% |
4.1% |
|
Maharashtra |
2.6% |
2.8% |
|
Gujarat |
2.5% |
1.7% |
|
Madhya Pradesh |
4.1% |
3.6% |
|
Odisha |
3.5% |
3.0% |
|
Karnataka |
3.0% |
2.7% |
|
West Bengal |
3.6% |
3.5% |
Source: Forbes, India
Figure 2: Graphical Representation of States' Fiscal Deficit
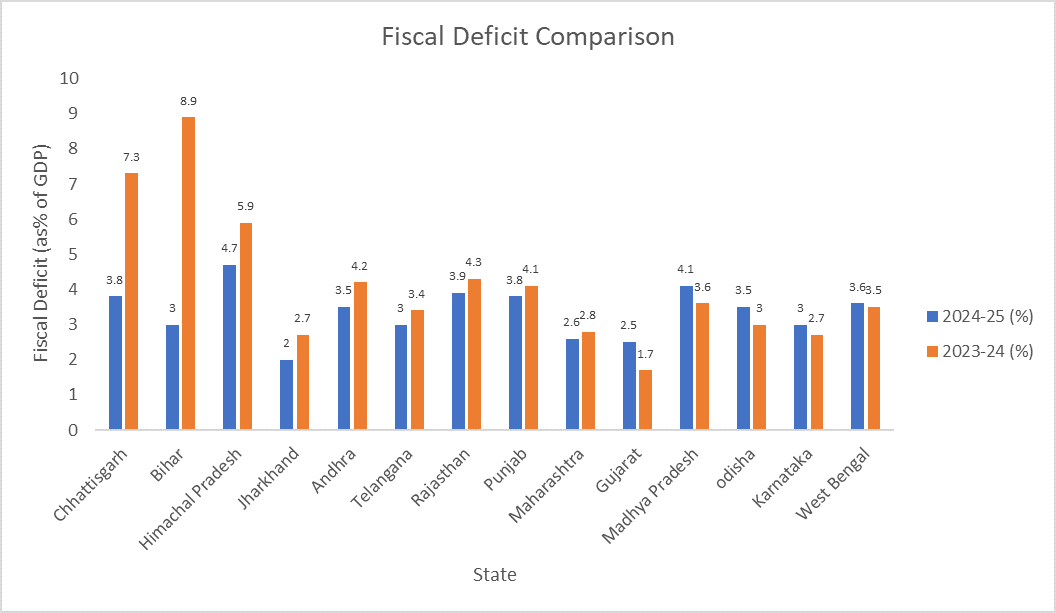
The fiscal deficit comparison (Table 2) and (Figure 2) indicates improvements in some states and slight adjustments in others. Bihar saw the biggest drop in fiscal deficit, reducing from 8.9% in 2023-24 to 3.0% in 2024-25. Likewise, Himachal Pradesh improved from 5.9% to 4.7%, and Chhattisgarh improved from 7.3% to 3.8%. Jharkhand is also among those states whose deficit has reduced from 2.7% to 2.0%. Other states that performed a bit better include Andhra Pradesh and Telangana, as their fiscal deficit marginally increased to 3.0 percent and 3.4 percent respectively, and in the case of Rajasthan, it decreased from 4.3 percent to 3.9 percent. Maharashtra merely decreased to 2.6 percent from 2.8 percent. On the other hand, Gujarat and Madhya Pradesh increased their fiscal deficits to 2.5 percent and 4.1 percent, respectively from 1.7 percent and 3.6 percent. Odisha and Karnataka saw small increases. West Bengal remained nearly the same, moving only to 3.6 from 3.5 percent.
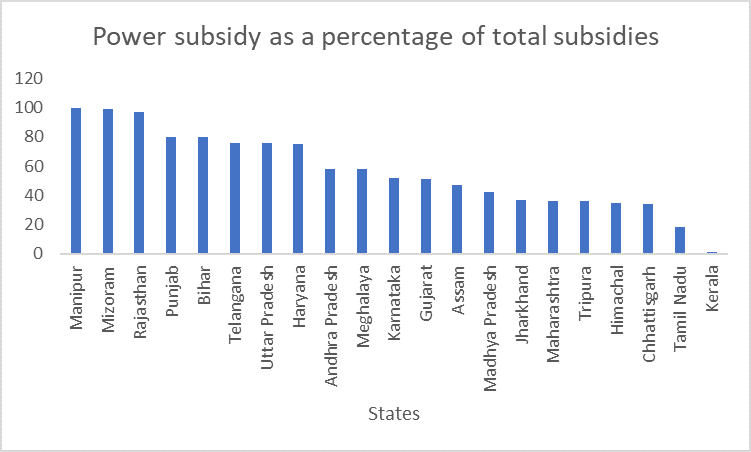
One can conclude that states have always reserved an enormous percentage of their revenue receipts. 8-9% since 2016-17 has been devoted to subsidies to make essential goods and services accessible to the citizens. In states like Rajasthan, Punjab, and Bihar, subsidies for electricity have formed an overwhelming portion of the total subsidy budget, at 97% in Rajasthan and around 80% in Punjab and Bihar in 2021-22. Although these subsidies are supposed to make power cheaper, the IMF has noted that wealthier households benefit more from such subsidies since they consume more electricity than the poor (IMF, 2013).
Table 3: State-wise Budget Expenditure to Subsidising Electricity (2021-22)
|
States |
Percentage |
|
Manipur |
100 |
|
Mizoram |
99 |
|
Rajasthan |
97 |
|
Punjab |
80 |
|
Bihar |
80 |
|
Telangana |
76 |
|
Uttar Pradesh |
76 |
|
Haryana |
75 |
|
Andhra Pradesh |
58 |
|
Meghalaya |
58 |
|
Karnataka |
52 |
|
Gujarat |
51 |
|
Assam |
47 |
|
Madhya Pradesh |
42 |
|
Jharkhand |
37 |
|
Maharashtra |
36 |
|
Tripura |
36 |
|
Himachal |
35 |
|
Chhattisgarh |
34 |
|
Tamil Nadu |
18 |
|
Kerala |
1 |
Sources: Finance-Accounts 2021-22.
Figure 3: Graphical Representation of State-wise Budget-Expenditure to Subsidising Electricity
Composition-Expenditure in 2023-24
The governmental expenditure can be broadly divided into: (i) revenue, and (ii) capital expenditure. In the year, 2023-24 (The Hindu,2024), the revenue expenditure of states is estimated to be 83% of the total expenditure while capital expenditure is budgeted to be 17%. In 2023-24, states would spend approx. 53 per cent of the revenue receipts on committed expenditure. This includes around 28 percent of revenue receipts, which would be spent on salaried and wage employment, 13 percent on pension, and 12 percent on the payment of interest on loans. States like Himachal Pradesh, Kerala, Nagaland, and Punjab are predicted to spend 70 percent or more on committed expenditure. In contrast, the expenditure of Bihar, Odisha and Jharkhand is estimated to be lower than the average of all states, primarily due to lower spending on salaries and wages.
Sector-wise Expenditure (2023-24)
Below we present the expenditure by states on key sectors based on the budget provisions of 2023-24. Expenditure incurred on a particular sector shares the total expenditure of a state budget. Expenditure made on a particular sector would be the resultant of its revenue expenditure added to capital outlay undertaken in the said sector.
Table 4: Sector-wise Expenditure in 2023-24 of Indian States
|
States |
Education |
Socialwelfare & Nutrition |
Agriculture |
RuralDevelopment |
Energy |
UrbanDevelopment |
|
Andhra Pradesh |
12.6 |
4.3 |
5.4 |
6.2 |
2.1 |
3.5 |
|
Arunachal Pradesh |
9.9 |
3.3 |
7.6 |
3.3 |
7.5 |
4.1 |
|
Assam |
16.8 |
6.6 |
4 |
3.3 |
1.1 |
3 |
|
Bihar |
17.9 |
6.2 |
3.3 |
10.7 |
4.8 |
3.7 |
|
Chhattisgarh |
19.4 |
3.8 |
16.4 |
4.9 |
4.8 |
3.6 |
|
Delhi |
24.3 |
7 |
0.5 |
0.2 |
4.9 |
6.5 |
|
Goa |
14.9 |
4.1 |
2.7 |
2.3 |
15.4 |
2.6 |
|
Gujarat |
14.3 |
3.9 |
4.3 |
2.9 |
7.7 |
6.6 |
|
Himachal Pradesh |
18.9 |
5.8 |
5.9 |
4 |
1.3 |
1.3 |
|
Haryana |
14 |
8.6 |
5.2 |
5 |
5.7 |
3.9 |
|
Jharkhand |
14.5 |
8.3 |
5.5 |
13.6 |
3.4 |
3.1 |
|
J&K |
14.7 |
4.2 |
6.9 |
4.5 |
5.8 |
3.5 |
|
Karnataka |
11 |
11.5 |
7.3 |
3.1 |
7.5 |
0.6 |
|
Kerala |
14 |
7.1 |
4.5 |
4 |
0.1 |
1.1 |
|
Meghalaya |
14.8 |
4 |
5.7 |
7.6 |
3.4 |
2.3 |
|
Maharashtra |
16.6 |
3.7 |
5.9 |
4.7 |
2.3 |
3.8 |
|
Manipur |
11.5 |
3.5 |
4.3 |
16 |
1.8 |
3.3 |
|
Madhya Pradesh |
16.1 |
7.5 |
6.4 |
4.5 |
9 |
2.6 |
|
Mizoram |
14.7 |
1.9 |
6.2 |
2.6 |
6.5 |
4.7 |
|
Nagaland |
16.1 |
2.9 |
6.6 |
4.7 |
4.7 |
1.3 |
|
Odisha |
13.2 |
6.1 |
6 |
7.1 |
1.5 |
2.3 |
|
Punjab |
13.1 |
6.7 |
10.2 |
1.1 |
5.9 |
2 |
|
Puducherry |
11.5 |
8.1 |
5.6 |
1.1 |
18.2 |
4.2 |
|
Rajasthan |
19.5 |
6.8 |
4.3 |
6.9 |
8.9 |
4.7 |
|
Sikkim |
16.4 |
4 |
6.7 |
3 |
4.1 |
4.9 |
|
Tamil Nadu |
14.1 |
7.6 |
6.5 |
2.7 |
2.4 |
2.4 |
|
Tripura |
12.3 |
6.8 |
5.7 |
6 |
1.8 |
4.6 |
|
Telangana |
7.6 |
7.8 |
11.7 |
3.6 |
4.9 |
2.8 |
|
Uttarakhand |
16.6 |
6.9 |
7.6 |
7.4 |
1.8 |
1.9 |
|
Uttar Pradesh |
13.1 |
5.1 |
2.9 |
5 |
6.7 |
4.4 |
|
West Bengal |
16.5 |
13.3 |
6.4 |
5.8 |
1.2 |
4.2 |
Sources: State Budget Documents; PRS.
Figure 4: Sector-wise Expenditure (2023-24)
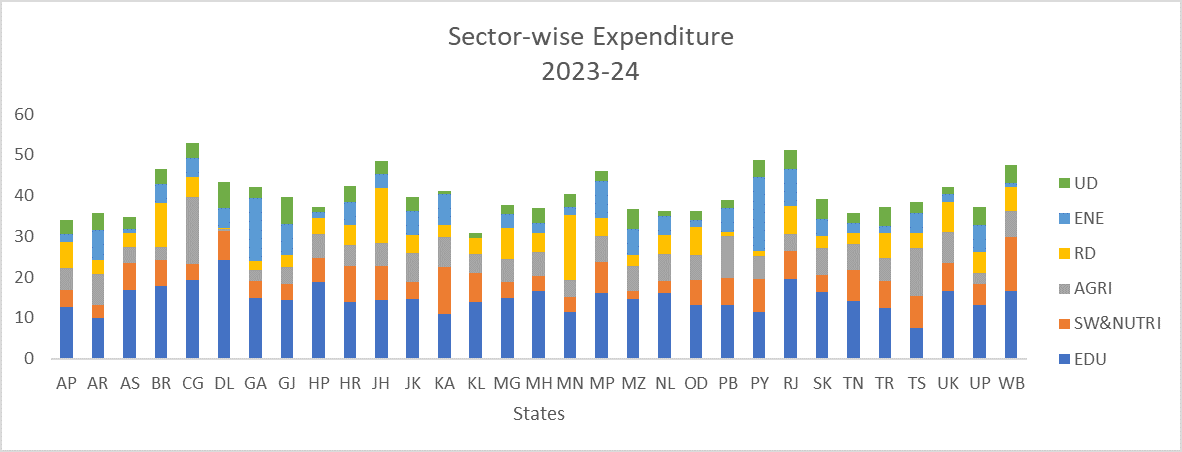
Source: Authors Compilation
Punjab Budget Analysis 2024-25
The budget estimates of the Punjab Government for the fiscal year 2024-25 unfolded highlighting that the GSDP is expected to increase by about 9% compared to the previous year (Budget of Punjab, 2024). The total spending of ₹1,29,450 crore for 2023-24 is lower by 4% than the initial estimates. Further, the estimated receipts would be ₹1,04,586 crore, which is an increase of 5.5% from the revised estimate for 2023-24 which was 1% below the estimated budget amount. Taking revenue deficit into consideration, the estimate is expected to be 2.9% of GSDP as compared to the previous year’s deficit of 3.2% of GSDP. Punjab has, however, lowered its fiscal deficit from 4.98% to 4.1% of GSDP and further plans to reduce the deficit to 3.8% for 2024-25.
Overview of Punjab's Economic Structure (2023-24)
GSDP-Growth
According to the data, this year, the GSDP in Punjab stands at 6.8% (constant prices). It is relatively on the lower side compared to GDP growth rates than the 7.6% national growth rate.
Sectoral Contributions
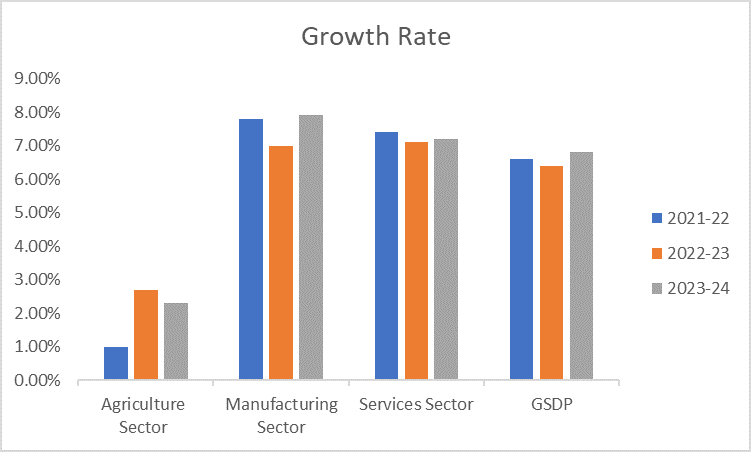
Contributions of important sectors- agriculture 27%, manufacturing 27% and services sector 46 % (in constant prices). The Agri sector showed a growth of 2.3% with a modest development. With a growth rate of 7.9%, the Manufacturing sector contributes quite significantly to the overall growth of the economy, while the Services sector accounts for 7.2% growth, which indicates its significant share in the economy.
Income Per-Capita
With a rough estimate of ₹1,95,621 (current prices), Punjab has higher per capita income than the national average of ₹1,83,236, indicating a relatively higher living standard in Punjab.
Unemployment
Punjab has an unemployment rate of 6.1 which is significantly higher compared to the national average of 3.2% pointing at employment issues in the state (Kulshrestha et al., 2018).
Table 5 below indicates that Punjab's economy is significant and growing, with significant contributions from the manufacturing and service sectors, while major area like agriculture needs to be improved to generate employment.
Table 5: Punjab's Economic Structure
|
Sector-Growth Rate |
2021-22 |
2022-23 |
2023-24 |
|
Agriculture Sector |
1.0% |
2.7% |
2.3% |
|
Manufacturing Sector |
7.8% |
7.0% |
7.9% |
|
Services Sector |
7.4% |
7.1% |
7.2% |
|
GSDP |
6.6% |
6.4% |
6.8% |
Source: PRS, India
Figure 5: Punjab's Economic Structure
Budget Estimates for 2024-25
Revenue and Fiscal Deficits
Revenue deficit, as estimated for the financial year 2024-25 is Rs. 23,198 crores (2.89% of GSDP), lower than the estimate of 3.23 % for 2023-24. The fiscal deficit, in the financial year 2024-25 is projected to be 3.8% of GSDP, higher as compared to the estimate of 4.12% of GSDP for the financial year 2023-24.
Expenditure for 2024-25
For the year 2024-25, the revenue expenditure is projected to be around ₹1,27,134 crore, indicating an increase of about 4% as compared to the FY 2023-24. So far as capital expenditure is concerned, an estimate for capital expenditure for the year 2024-25 is ₹7,445 crore, which is about 16% more than the previous estimate for FY 2023-24.
Commitment spending
According to the estimates of the budget for 2024-25, Punjab committed expenditure is projected to be 78,868 crores (76% of total receipts) which includes interest payments, pensions, and salaries. In the financial year 2022-23, around 80% of the total revenue receipts was allocated to state’s committed expenditure
Power Subsidy
The estimated amount of budget allocated for power subsidy for 2024-25 is ₹20,200 crores (19% of Punjab’s total revenue). The amount spent on power subsidies was about ₹13,443 crore in 2021-2022 which is 17% of revenue receipts. Over the years, the trend indicates an increase in the amount of subsidies being provided by the government (Singh, 2017).
Receipts for the year 2024-25
For FY 2024-25, Punjab’s total receipts are estimated to be ₹ 1,03,936 crore which is increased by 5% as compared to FY 2023-24. The Punjab state heavily relies on the state’s own resources (67%) that account for tax and non-tax revenues and the centre transfers (33%).
The allocation in the 2024-25 budget of Punjab shows focused but uneven investments across the critical sectors:
- Education
The budget allocated for the education sector amounts to 12.9% which is quite less than the national average of 14.7%. Less budget allocation would result in a decline in the education system and its quality, in both rural as well in urban areas.
- Agriculture
Punjab state has allocated about 10.1% of the total budget on the agricultural sector which is higher than the 5.9% of the national average. The state emphasised the agricultural sector as the allocated budget might benefit farmers and their agricultural growth (Kulshrestha & Agrawal, 2019).
- Healthcare
The healthcare budget of Punjab is 4.6% which is far less than the national average of 6.2%. Promoting healthcare facilities, hospitals, health initiatives and increased investment, may positively impact population health outcomes which is one of the most crucial sectors for maintaining a healthy workforce.
- Urban-Development
Only 1% of the total budget is allocated for urban development, much lower than the average of 3.4%. Also, the funding for urban development may be found insufficient to support expansion and sustainable development.
Conclusion
The report gives a detailed analysis of the financial condition of Indian states for FY 2023-24 and FY 2024-25. It details how the centre is also strategising about "Less Expenditure, More Income" as a support for states toward better finances. The report states that Punjab and Rajasthan managed to reduce fiscal deficits last year; however, this was different from Gujarat and Madhya Pradesh, as the others witnessed increasing pressure on finances. States are very variable in their fiscal deficits. For example, Himachal Pradesh and Madhya Pradesh have high deficits of over 4% of GDP; on the other hand, Bihar leads the effort for significant fiscal burden reduction.
The subsidies in these states pose challenges regarding the state governments in electricity and form one of the biggest components in the states' budgets along with Punjab and Bihar for Rajasthan. Politically popular, experts said that subsidies will strain long-term fiscal health as more resource-intensive households consume relatively higher amounts of it. So, the states' fiscal deficits are likely to average around 3.1 percent of Gross State Domestic Product in 2023-24 and debt burdens to increase to over 40 percent of GSDP for several states including Uttar Pradesh and Tamil Nadu.
Punjab state is set to achieve GSDP growth of 6.8% to reduce fiscal deficit to 3.8% of GSDP and the debt-to-GSDP ratio to 44.1%. Agriculture is leading the chart at an incredible 10.1%, whereas education and healthcare remain lower than the average national figures. Even though the focus is on high-impact areas, the binding committed spending in salaries, pensions, and power subsidies limits its development spending potential. The report concludes that while states have been doing much in terms of managing the levels of debt, they must ensure a balance between providing welfare and financial health.
References
Government of India (2003). Ministry of Finance, Fiscal Responsibility and Budget Management (FRBM) Act, 2003 and FRBM Rules, 2004.
International Monetary Fund (IMF, 2013), For Richer, Not Poorer: Energy Subsidies in India. Available at: https://www.imf.org/en/Blogs/Articles/2013/06/24/for-richer-not-poorer-energy-subsidies-in-india
Kulshrestha, D., & Agrawal, K. K. (2019). An econometric analysis of agricultural production and economic growth in India. Indian Journal of Marketing, 49(11), 56. https://doi.org/10.17010/ijom/2019/v49/i11/148276
Kulshrestha, D., Kumar Agrawal, K., & Kumar Jakhoria, S. (2018). An Analytical Study On Employment And Indebtedness Of Rural Households: Evidence From Gujarat. Pezzottaite Journals, 7(1).
Outlook Business Report (2024). State Spending is Ballooning. What Does it Mean for India’s Fiscal Position?
Press Information Bureau (2024). Revised Fiscal Deficit Target for FY25 Announced by FM Nirmala Sitharaman. Available at: https://www.pib.gov.in
PRS India (2023), State of State Finances 2023-24. Available at: https://prsindia.org/budgets/states/policy/state-of-state-finances-2023-24.
Singh, G. (2017). Subsidies in international trade from the wto perspective. In G. Singh, Subsidies in the Context of the WTO’s Free Trade System (pp. 37–133). Springer International Publishing. https://doi.org/10.1007/978-3-319-62422-8_2
State Budget of Punjab for 2023-24 (2024). Available at https://finance.punjab.gov.in/StateBudget/Index
State of States (2024). A Review of FY25 State Budgets. Economic Policy and Research, National Stock Exchange (NSE) of India Ltd. Available at https://nsearchives.nseindia.com/web/sites/default/files/inline-files/State_Budget_Analysis_FY25_20241015.pdf




Comments