India’s Emerging Demographic Profile: Select Policy Implications
- In Economics
- 08:31 PM, Nov 18, 2022
- Mukul Asher
As the world welcomes the landmark of 8 billion persons, it may be useful to examine India’s demographic profile and the select policy implications arising from it. Demographic trends affect every aspect of economy, finance, society, and polity. Indeed, analysts have observed that demographics is to economics what gravity is to physics. Therefore, a thorough understanding of emerging demographic trends for sound policies cannot be overemphasized.
Key characteristics of India’s Demographic Profile
The main data source used in this column is the United Nations, World Population Prospects 2022, regularly published by its Population Division1.
Figure 1 provides projections of India’s total population. A median fertility rate assumption, with 95 percent confidence interval is used. The figures would differ if low or high fertility rate assumption is used.
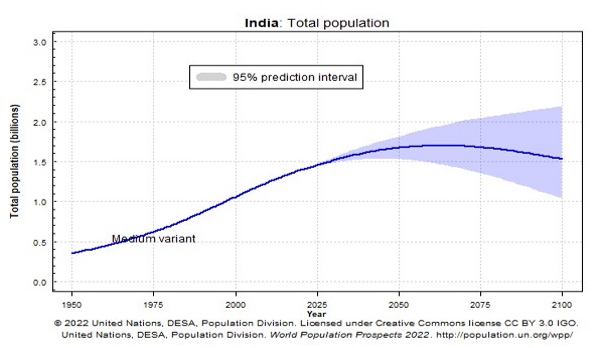
Figure 1 India: Total Population, 1950 to 2100
Figure 1 suggests the following. India’s total population has been growing since 1950, but the rate of growth has been slowing as shown by the flatter slope of the curve. Indeed between 2050 and 2075, India’s total population is projected to decline absolutely, albeit at a very gentle rate. The further the projections are made, the greater the variability in projections, as may be expected.
India’s share in the global population is expected to decline slightly from 17.7 percent in 2020 to 16.8 percent in 2050. This implies that the global population is projected to grow at a rate higher than that of India.
Figure 2 brings out more starkly the public policy and societal implications of total population projections of India and China. As compared to India, China’s population is projected to decline moderately rapidly after 2020-2040 period and may be only somewhat above the 1950 level in 2099. India’s population will begin to decline much later, and more gently, so by 2099 it will still have around 3.5 times the population it had in 1950. The two countries will therefore need to adjust their economy, society, diplomacy, and polity accordingly. These could have substantial geo-economic and geo-strategic implications for India and the world.
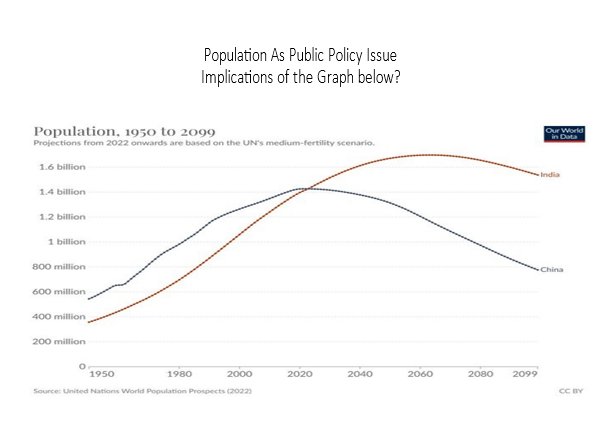
Figure 2 Total population Projections of India and China: 1950-209
Figure 3 provides projections, for 1950-2100, of India’s population by broad age groups. A sharp decline 0-20 age group is projected, with its number declining from 500 million in 2000 (48.4 percent of the total) to 431 million in 2050 (25.8 percent of the total). In contrast, the working age population of 21 to 64 years is projected to rise from 512 million in 2000 (48.4 percent of the total) to 990 million in 2050 (59.2 percent of the total). India will thus be advantaged by having a very large working-age population. This will give an important advantage to India, including in technological adoption and innovation.
In contrast, the number of over 65 population will increase from 48 million (4.5 percent of the population) in 2000 to 256 million in 2050 (15.0 percent of the population). Though not in Figure 3, in 65 + age group, the UN source cited above suggests that those over 80 years of age are expected to increase from 13.3 million in 2020 (1.0 percent of the total population) to 43.0 million (2.6 percent of the total population) in 2050. This is a 323 percent increase, as compared to about 250 percent increase in over 65 population, which will be 256 million in 2050. This is not only a large number, but it signifies a rapid pace of increase for the over 80 years age group. Policy implications of this are noted later in this column.
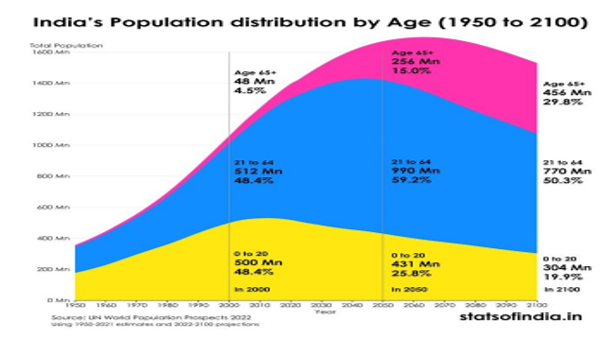
Figure 3 India’s Population Distribution by Age, 1950 to 2100
Figure 4 suggests that in 2021, the median age of India’s population was 28 years. According to official figures, India’s median age which was 26.6 years in 2016, is expected to rise to 34.7 years by 2036.
Broadly, western, and southern states had higher median age than India’s average, northern and most eastern states had lower median age. This implies that in strategies to cope with demographic challenges, variations across states would need to be considered.
Figure 4 India’s Median Age of Population, 2021
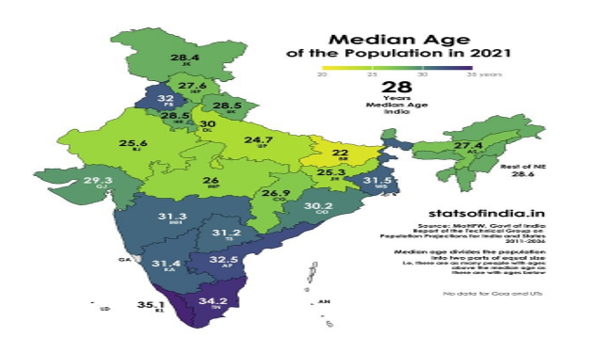
Figure 6 provides data on India’s Total Fertility Rate (TFR) for the period 1950 to 2100.TFR measures the average number of children a woman produces over her lifetime. TFR of 2.15 is regarded as a replacement rate, implying that once this rate is achieved and sustained, the population becomes stable after three to four decades, assuming no net immigration. If TFR is sustained below 2.15 for a prolonged period, the population will decline, assuming no net immigration. In Asia, such decline is projected for China, Japan, South Korea, Thailand, Vietnam, and others.
The data for India exhibit declining TFR from a very high rate of near 6 to below replacement rate of 2.0, and stabilizing around that rate. Before 2025, India’s TFR is expected to be about the same as that of Asia, and remain there. India’s TFR has been below that of Southern Asia since the 1950s.
Figure 5 India’s Total Fertility Rate (TFR), 1950-2100
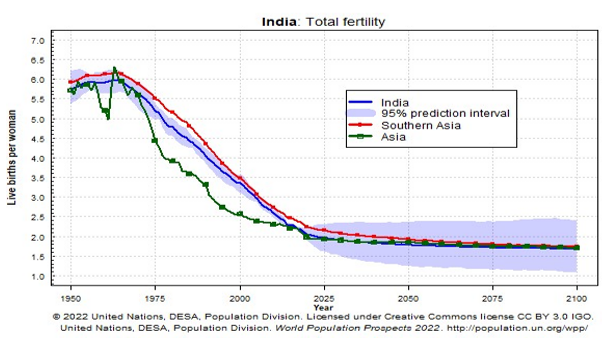
Figure 6 provides data on India’s TFR by States for 2019-20. Data suggest that India as a country has achieved a TFR below the replacement rate. Only Bihar and Meghalaya exhibit TFR above 3. Uttar Pradesh, India’s most populous state exhibited TFR of 2.4. It is making progress towards the replacement rate. Some large states, Maharashtra at 1.7 In the western part, and Odisha at 1.8 in the eastern part exhibit the same or lower TFR than the southern states. Therefore, an argument sometimes advanced that states in the southern part are unique in having low TFR is found to be without merit on empirical grounds.
Figure 6 India’s Total fertility rate, by States, 2019-20
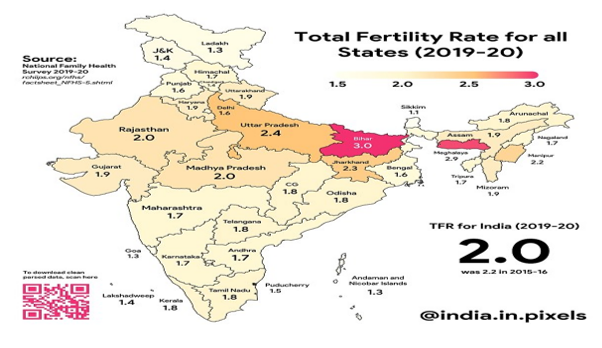
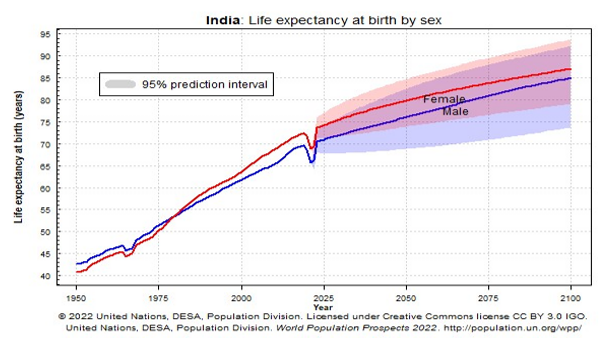
Figure 7 provides data on life expectancy at birth from 1950 to 2100. A notable feature is that until about 1980, female life expectancy at birth was lower than that of men, a trend contrary to global experience which suggests that women live between 3 and 7 years more than men. But since then, the life expectancy of women in India have reverted to the global norm.
The main implication is that as women have lower lifetime incomes than men, as they do most of the essential work which is not paid, retirement income arrangements must take survivors risk into account. Feminization of the elderly population is not just Indian but a global phenomenon.
Figure 7. India: Life Expectancy at Birth: By Sex
Policy Implications
The above description of India’s demographic trends suggests that India is ageing moderately rapidly. The first policy implication is that India, like every society experiencing ageing, must rely on improving total factor productivity and on extensive application of science which is universal to technology which is local. Mere increases in labour and capital are not enough for sustaining high growth in ageing societies.
Second, India’s aged population, both over 65 and over 80 years, are projected to grow rapidly. Moreover, the pace of ageing would be uneven across the country. This has major policy implications for health care as long-term healthcare arrangements will be needed. Uneven ageing will also have implications for the cross-state migration of workers.
Policy initiatives for ageing should recognize that the elderly require accessible and affordable services of reasonable quality and that monetary aspects alone, though very necessary, should not be over-emphasized.
Since 2014, the government led by Prime Minister Modi has recognized this aspect. This is exemplified by such schemes as the Ayushman Bharat Health insurance scheme and wellness centres across the country), Ujjwala Yojna (clean cooking gas scheme) Pradhan Mantri Awas Yojna (for housing), Jal Jeevan (for tap water of good quality at home) Janaushadhi stores (provision for affordable common medicines) and several others. These initiatives centre on process reform by service-delivering organizations, and by up-to-date technology adoption in research, features which have been underappreciated in policy and academic research circles. Most of the above schemes have their own extensive and UpToDate performance dashboard. An overall dashboard of schemes may be found at https://transformingindia.mygov.in/performance-dashboard/.The data on these dashboards provide granular data for much data-intensive research at all levels of India.
The contingent liabilities of these schemes on the fiscal resources however need to be better researched and documented. For the orderly management of liabilities, a sinking fund to meet these liabilities also deserves serious consideration.
The policies for the elderly need to rely as much as possible on having the elderly age at home or to as near to home as feasible. The average number of persons in a household was estimated at 4.4 in India in 2022; while in 2021, the corresponding number for the OECD (organization for Economic Cooperation and Development), which, has more pronounced ageing trends than India was much lower, ranging between 2 and 2.5.
India’s ageing policies must continue to nurture the centrality of family and local community and their responsibilities for aged care, with the state providing a conducive environment, including elderly-friendly infrastructure and amenities, and promoting socio-cultural norms arising from India’s civilizational ethos, conducive for such responsibilities. Raghuvendra Tanwar, Chairperson of Indian Council of Historical Research has argued that research at Rakhigarhi site of Harappan civilization suggests that India is the oldest civilization in the world, and is mother of democracy. (Times of India, Mumbai edition, November 18,2022, p. 14).
Very selective institutionalized aged care options will still be needed. As far as feasible, social enterprises and not-for-profit organizations should be encouraged in this sector.
Third, the major policy implication is to devote greater resources to develop skill sets and infrastructure for studies in gerontology, which examine all dimensions of ageing, particularly, non-financial aspects, which may impact the well-being of the elderly.
Fourth, developing Long -Term health care organizations, structures, and financing modes has acquired greater urgency. Long-health care provides, particularly those above 80 years of age, who cannot perform daily functions without assistance, options, home-based, community-based, or institution-based, to live as normal and independent life as possible.
Concluding Remarks
The analysis of India’s emerging demographic trends strongly suggests a need for a mindset change from that India as a young country to India having about two decades to prepare for a moderately ageing population. This is like a change in mindset from India being a rural country, to prepare for the time when the majority of India will be urban or para-urban.
As persons live longer, life insurance costs decline, but annuity returns, pension, and health care costs increase sharply. These can not be managed without extensive investment in data collection and data analytics. Only granular data can provide information for the proper pricing of various insurance and pension products.
The analysis also suggests that demographics encompass wide areas of economic behaviour and society. Moreover, with moderately ageing trends, gerontology studies need to be developed. It is therefore strongly urged to establish a National Centre for Retirement and Ageing Behaviour or any other suitably named centre. It should be staffed by experts in diverse fields, including those specializing in data analytics, and actuarial studies.
Innovative technology-driven schemes since 2014, providing essential digital, financial inclusion, health, water, medicines, cooking gas, property rights to housing and land, physical connectivity and others of the union government, and similar schemes of state governments designed for ease of living, and for reducing household expenditure, including those of the elderly have received insufficient attention of the researchers. Good quality, timely, and granular data on these schemes are available but have not been much utilized. This is also an area which needs to be addressed by the researchers.
Reference
- https://www.un.org/development/desa/pd/content/World-Population-Prospects-2022 -accessed on November 10, 2022
Disclaimer: The opinions expressed within this article are the personal opinions of the author. MyIndMakers is not responsible for the accuracy, completeness, suitability, or validity of any information on this article. All information is provided on an as-is basis. The information, facts or opinions appearing in the article do not reflect the views of MyindMakers and it does not assume any responsibility or liability for the same.




Comments