


Analyzing the 2019 Lok Sabha Numbers Closely: How the BJP crossed 303 on it own- Part 1
- In Politics
- 04:06 AM, May 31, 2019
- Mohal Joshi
.png)
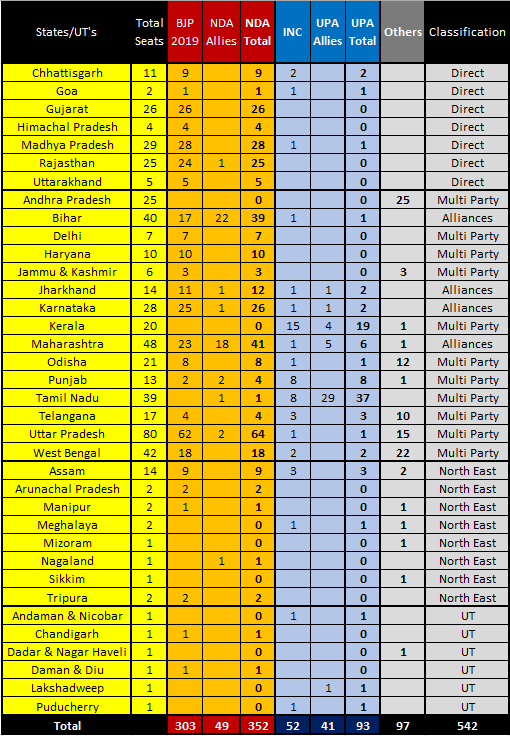
After the stupendous victory of BJP in the 2014 Lok Sabha elections, some had already written of the BJP from winning again in 2019 calling the 2014 performance as an outlier or specifically a “black swan” event. The sheer magnitude of the victory of BJP & its NDA allies on May 23rd has put to rest any such lazy analysis by its most vocal critics. BJP bettered its 2014 tally of 282 sets by winning its highest ever tally of 303 seats (+21 seats vs 2014). BJP’s NDA allies won 49 seats taking the overall NDA tally to 352 seats well above the 272 mark required for majority. INC won just 52 seats while its allies won 41 seats bringing the UPA alliance tally to 93. Others consisting of mostly regional parties not aligned with either bloc & independents won the remaining 97 seats. The sheer scale of the NDA landslide can be judged from the fact that neither the UPA nor did the others crack the triple digit mark.
BJP VOTE SHARE & SEATS:
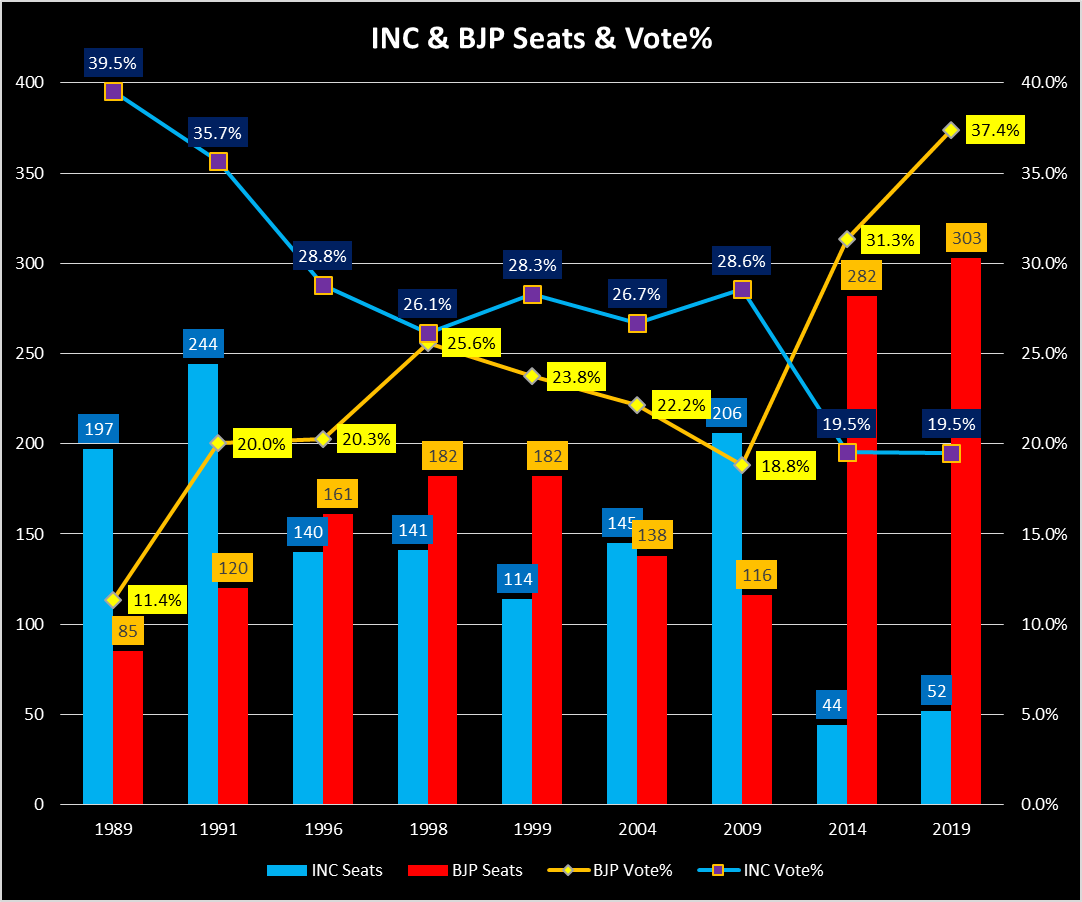
BJP’s vote share which was around ~20% in 1991 & 1996, grew to 25.6% in 1998 election. However it then steadily declined in the next 3 elections to bottom out at just less than 19% in 2009 before the massive spike up to 31.3% in 2014. Traditionally one would expect an incumbent’s vote share to either be stable or lose some vote % due to anti-incumbency but here BJP managed to increase its vote share from 31.3% in 2014 to 37.4% in 2019 (a significant 6.1% increase). NDA vote % (BJP + Allies) increased from 38.5% in 2014 to 44.9% (+6.4% increase).
As we dig deeper into the data from this historic election we will come across more & more astonishing & mind boggling statistics as the days & months go by. Here are some of these records
- Out of the 14 Prime Ministers (PM) that India has ever had Narendra Modi became just the 4th PM ever to get re-elected after serving a complete 5 year term
(First three were Jawaharlal Nehru: 1957 & 1962, Indira Gandhi: 1971 & Manmohan Singh: 2009). Note: Atal Bihari Vajpayee did get re-elected while being as incumbent PM in 1999 but he didn’t complete a full term) - Considering the NDA vote share of 44.9% this is the 4th highest vote share% that has ever been got in general elections.
(Highest 3 vote % in general elections were by Janata Party in 1977: 51.9%, post Indira Gandhi assassination in 1984: 48.1% & Nehru’s re-election in 1957: 47.8%) - Considering the NDA vote share of 44.9% this is the 2nd highest vote% ever acquired by an incumbent in a general election.
(Highest vote % was 47.8% during Nehru’s re-election in 1957) - The increase in NDA vote share from 38.5% to 44.9% (i.e. 6.3% increase) is the highest vote% jump ever in history of Indian general elections for an incumbent.
(Nehru between 1952 & 1957 & Indira between 1962 & 1967 gained around ~2.8-2.9% in vote % while Vajpayee gained only ~4.5% between 1998 & 1999)
INC VOTE SHARE & SEATS:
The vote share of INC (Indian National Congress) was above 35% in 1989 & 1991 cycles. It then went lower fluctuating between ~26 to 28.5% between 1996 to 2009 elections before bottoming out at 19.5% in 2014. In repeat from 2014, INC vote % this time around in 2019 is again at 19.5%. They didn’t enjoy any bounce as it was widely expected to do so while remaining in opposition. In comparison the NDA getting 44.9% of the vote the UPA alliance (INC + regional partners) was a distant second with just 26.9% of the vote.
They only marginally increased their seats which they won from paltry 44 to 52 in 2014. From these 52 seats, 8 seats were won in Tamil Nadu where they drew a blank in 2014. An alliance with the main regional party DMK there helped them massively to win these 8 seats. If you subtract this “tail wind assisted” 8 seats the adjusted 2019 tally of 44 is exactly same as 2014.
BJP vs INC:
The INC tally of 52 is very top heavy with a vast majority of seats from just a handful of states. This is partly due to the fact that INC drew a blank in exactly half of the 18/36 States & UTs (Union Territories) across India.
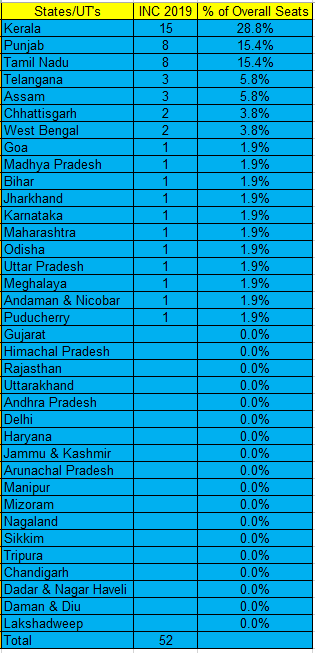
Just the top 3 (out of 36 States & UT’s) of Kerala 15, Punjab 8 & Tamil Nadu 8 contributes to ~60% of all their seats won in 2019. Taking the top 5 states & UT’s (i.e. including 3 seats each from Assam & Telangana in addition to the seats from the top 3 states) ~71% of their seats comes from these 5 states. The remaining 29% of seats won (i.e. 15 seats) are 1 or 2 seats from 13 other states & UT’s. This shows that INC has truly become an “onesie”/”twosie” party across most of India!
Now compare this to the BJP wins from 2019 which have come from 25/36 states & UTs.
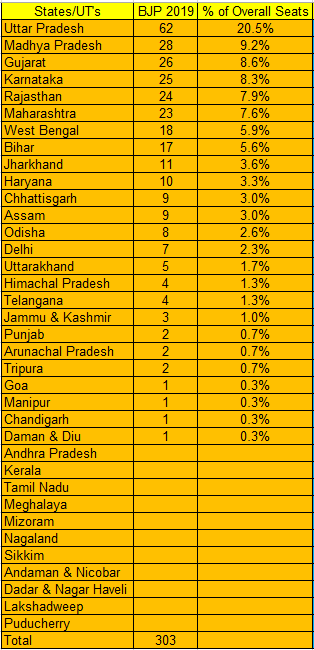
BJP has won only ~38 & 55% of their overall seats from their Top 3 & Top 5 states respectively (compared to 60 & 71% for INC)
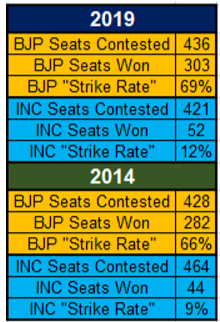
Looking at the “Strike Rate” (Seats Won / Seats Contested) INC’s “Strike Rate” is an extremely poor 12% vs 69% for the BJP. Both BJP & INC have managed to improve their strike rate by +3% point’s vs 2014.
Neelanjan Sircar an Assistant Professor, Ashoka University, and Visiting Senior Fellow, Centre for Policy Research in his article post the election results mentioned that just like in 2014 BJP has decimated the INC in head to head contests. Neelanjan says “In 2019, the BJP and Congress had 191 head-to-head contests, meaning that they were the top two finishers in a constituency. In these 191 constituencies, the BJP won 175 contests for a whopping 92% strike rate against the Congress. In 2014, the BJP had a similarly large strike rate of 86%.”
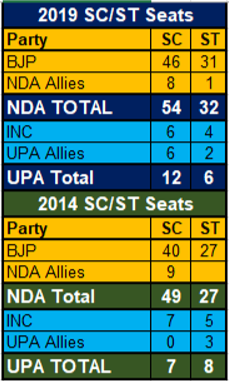
The last few years has seen a narrative put forward by some that BJP which gained a lot of support with the SC/ST communities in 2014 was now losing their support. Even some opinion polls/surveys were showing some erosion of support among SC/ST who were seen to be drifting away to INC or Other parties. The results on May 23rd however show that both BJP (46 & 31 for SC & ST respectively vs 40 & 27 in 2014) & NDA (54 & 32 for SC & ST respectively vs 49 & 27 in 2014) have in fact won more SC & ST seats vs 5 years ago.
>50%
Once a candidate crosses 50% of the vote it is mathematically impossible for anyone else to defeat him/her: i.e. No amount of consolidation of the vote via a “Mahagathbandhan” or any type of super alliance can defeat this. The number of seats where the winning candidate garnered >50% of the vote has increased dramatically from 200 (37%) in 2014 to 341 (63%) in 2019. There has been an increase in the winning candidates getting >50% of the vote from 1 in every 3 seats 5 years ago to almost 2 in every 3 seats this time around. This has been one of the lesser reported facts of the 2019 election cycle indicating that many of the fights would have been blowouts.
NDA alliance has won 256 seats with vote share >50% while UPA alliance won only 43 seats with >50% vote.
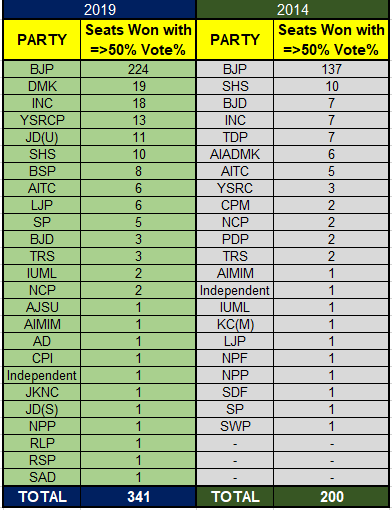
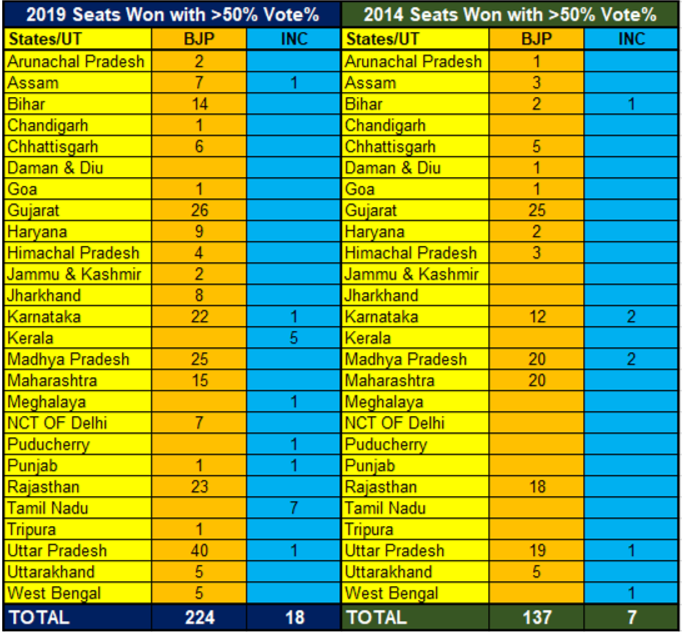
BJP has increased its count of seats won with >50% of the vote from 137 in 2014 to 224 in 2019. INC also has improved its performance by winning 18 seats with >50% vote vs just 7 last time around.
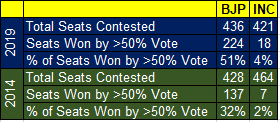
In terms of overall “strike rate” BJP won 1 out of every 3rd seat in 2014 with >50% margin. Now it has upped its “strike rate” of winning seats with >50% margin to almost 1 in every 2 seats they contest. This is an eye opening statistic which shows their sheer dominance in this election cycle. INC has doubled its “strike rate” from a dismal 2 to 4% but it still remains extremely low showing that they are struggling in many parts of the country.
Below is a state wide distribution of the seats won by BJP & INC with >50% vote share last time in 2014 & this time around in 2019. Note that for BJP the list is primarily dominated by seats in Western & Central India where they have swept practically all the seats on offer.
Now looking at data for 2019 elections from an alliance perspective of NDA vs UPA.
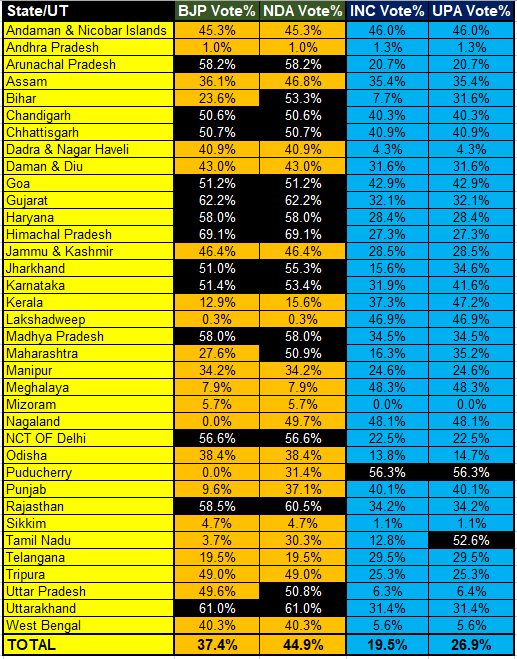
UPA was able to only breach the 50% in couple of States & UTs: Puducherry & Tamil Nadu. Tamil Nadu as we know that DMK was the main driving force of the alliance & most of the credit here would go to DMK (& its smaller allies).
BJP has been able to get >50% vote share in 13 States/UTs on its own while NDA crosses >50% vote share in 3 more states once you add up the allies votes. This means that in 16/36 States/UTs across India the NDA combination with >50% vote share was a formidable force to making them virtually unbeatable.
OTHER VOTE SHARE & SEATS
In the previous several election cycles (barring 1991) one has seen that the vote % of the big 2 national parties BJP+INC has remained fairly constant ~50% of the vote while the regional parties & independents have been getting the other 50% of the vote.
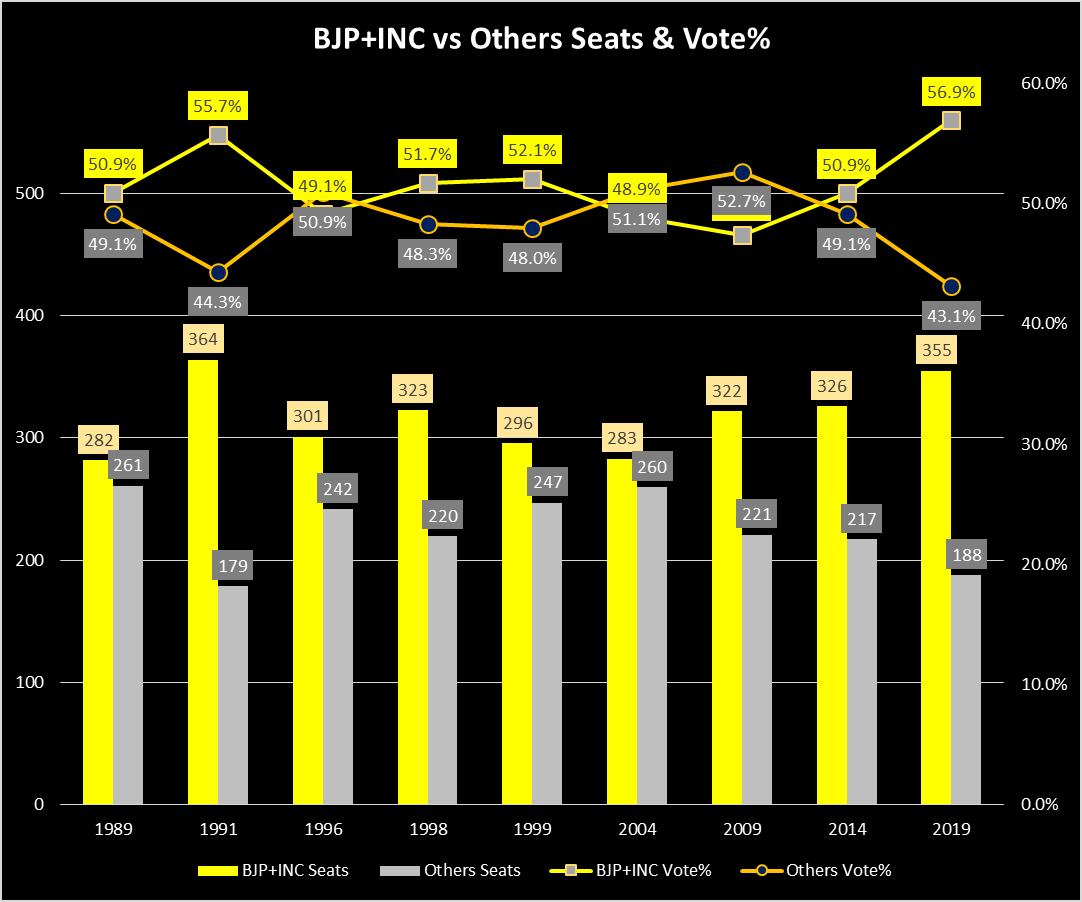
Looking at the combined seats won by BJP & INC they have been winning around ~300 to 325 seats in the previous election cycles (barring 2004 when both simultaneously underperformed & won only 283 seats together & 1991 when INC won 244 seats post Rajiv Gandhi assassination which created a sympathy wave for INC).
2019 has shown that now the Others have dipped to 43% of the vote for 1st time showing that clout of regional parties, smaller factions & independents is on the wane for now. Their no. of seats won by others which used to be in the 215 to 260 range has also dipped to below 200 for the first time since 1991. Most of this can be attributed to the spectacular rise of BJP & simultaneous decline of several regional parties across vast parts of India.
I plan to cover more on the national picture & the various states in detail in the future as part of my deep dive into the 2019 LS election results.
P.S.: I want to thank Vivek Madani for helping to pull the data for all 542 constituencies individually from the ECI website.


Comments